

Analytics Dashboard Components V 1.0
- Type
- Design System
- Format
- Figma file
- Available on
- UI8.net
Resource Description
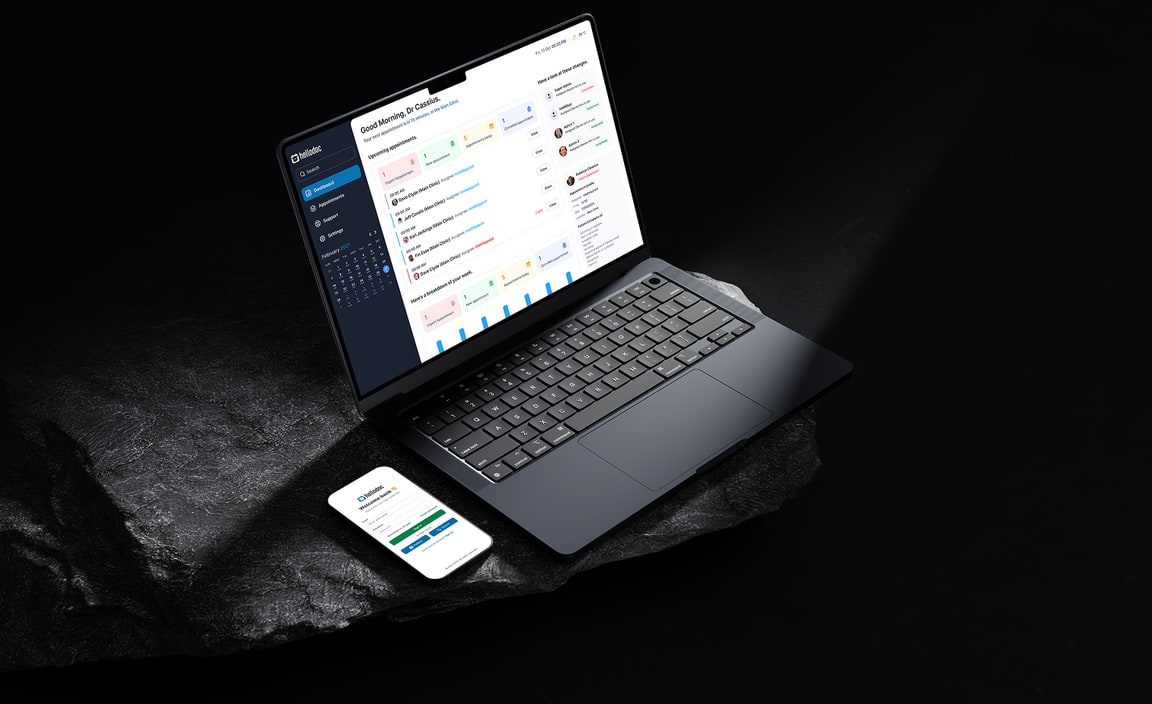
Reusable charts, tables and filters for analytics screens. A starter design system from the Endpoint Clients team. It gives you the building blocks, colours, type and components, organised so a product can grow without the design coming apart.
Why We Made It
As products grow, screens drift apart and teams redraw the same parts again and again. A design system keeps the experience consistent and the work faster.
Problem 1
Keeping screens consistent as more people contribute.
Problem 2
Avoiding repeated work on the same components.
Problem 3
Making design and development speak the same language.
Style Guide& Component
Typography
Manrope
ABCDEFGH
12345
Typography
Playfair Display
ABCDEFGH
12345
Wireframe
& UI Design
Workflow Scenario
We started with the structure, laying screens out as simple wireframes before adding colour, type and detail. Each decision was checked against how people would actually use Analytics Dashboard Components V 1.0, so the finished design stays clear and consistent from the first screen to the last.
The Result
A consistent product that is quicker to build. Designers and developers share one source of truth, and new screens come together faster.
Thank You for Downloading
Related Resources
See All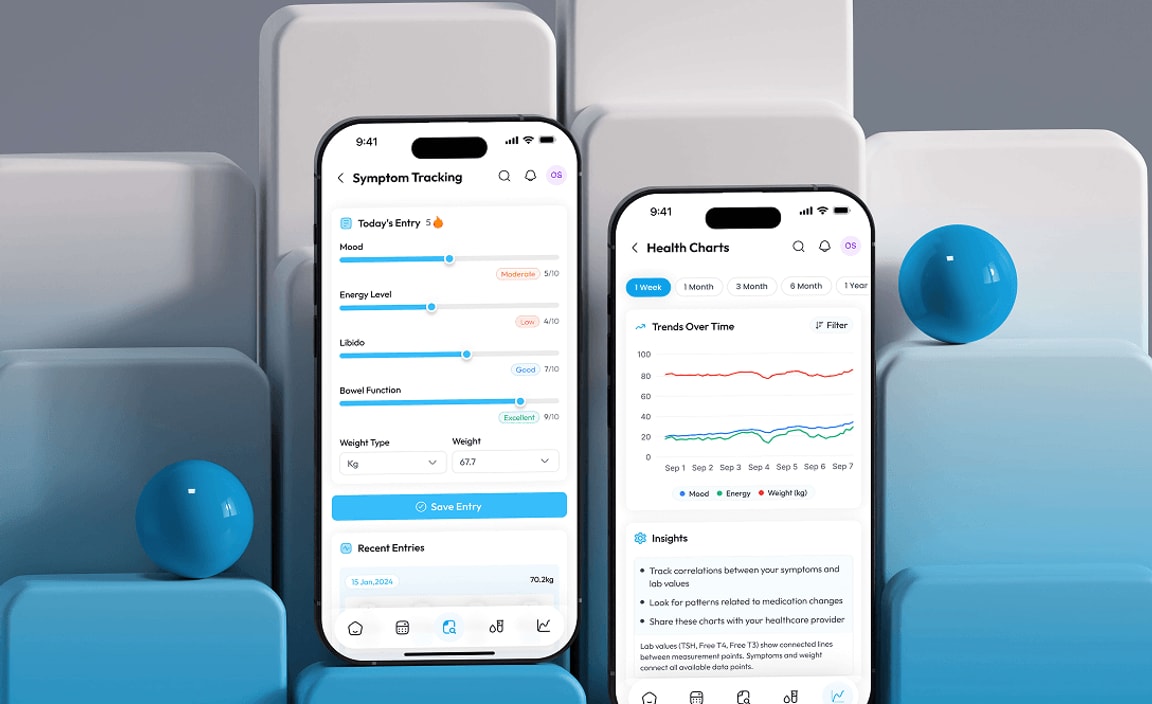

Want this tailored to your product?
Tell us what you are building and we can adapt a kit to your brand, or design the whole system with you.